Pattern Day Trader
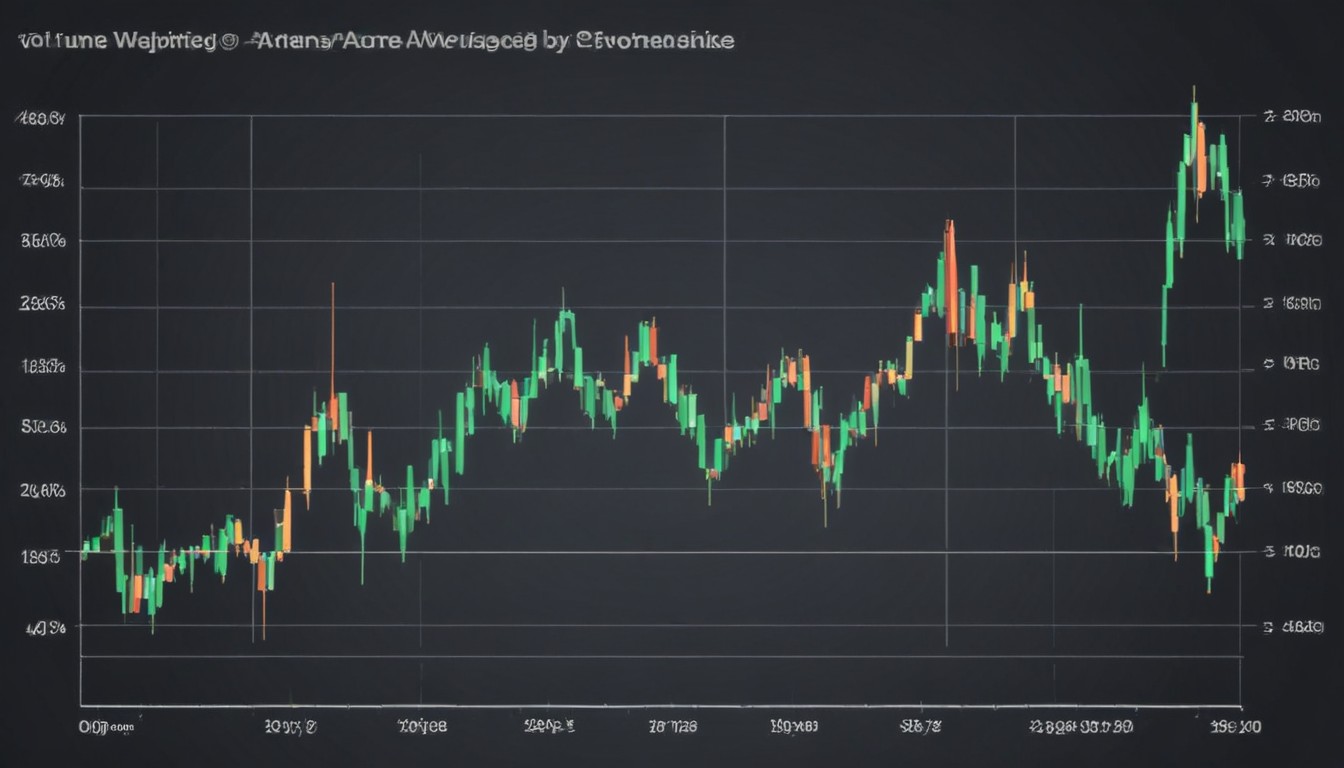
Volume weighted average price (VWAP) – is an index designed to show an average price an asset had during some period. The default span of time is a day, but this benchmark is usually described as an ‘intraday’ index, which means that it can be used for any period of time below 24 hours.
VWAP is calculated using both the value of the asset and its volume (the amount of shares that passed hands during the chosen period. You can use a simple formula to calculate the exact VWAP number for any time frame of the day. Of course, there are VWAP calculators readily available online, but the formula is very simple.
You can calculate it in your mind and keep the results in a spreadsheet format.
WVAP calculation
WVAP trading algorithm calculation formula is nothing special. It’s a simple average number calculation sequence, although with some corrections:
‘Value’ implies ‘average value for the day’, so don’t try measuring total value of all assets for the day.
What you’ll get is a VWAP for the chosen period, not the entire day. You’ll still be able to make some use of it (exactly what use – later on), but not as thorough as of the full-day index.
But if you want a simple sequence for spreadsheet work, here it is:
Take the arbitrary span of time (the smaller – the better) and add up three parameters – the highest price, the lowest price and the closing price.
Divide the resulting number by 3.
Multiple the resulting number by the volume of traded asset for that span of time.
Divide the resulting number by the volume of traded asset for that span of time.
It’s only the periodical index, however. To deduce the daily VWAP, you’ll have to calculate the same number for several identical periods of the day. Then add them all up and divide that number by the total amount of inputs during the day.
How can it help your daily routine?
VWAP is used in two major ways, however anyone can make their own conclusions and put them to use accordingly. The two ways are:
Checking the average price of the asset for the small period of time that just passed.
Checking the average price of the asset for the day that just passed
Each of these actions will give you some idea of a recent trend on the market, at least in regards to the asset you’ve used in your calculations. The companies use it as an indicator of a healthy price. Buying cheaper and selling costlier keeps the price more or less in the same place.
The regular investors and traders generally use VWAP to confirm their deductions about price, see if their trading model or predictions have proven true, and, if not, fix the issue by adding more data.
Advantages of VWAP index
Since this indicator is a fairly popular tool on investment front, it must be useful. And it is, but in its own small area.
It’s a great confirmatory instrument Various strategies and trading/investing models are butter and bread of any professional trader/investor. If you build the software or even the idea designed to help you invest with more success, you’ll have to flaw-check it once in a while.
VWAP is most useful for such tasks exactly. Have your algorithm predict the trend for the day, and then double-check it with VWAP. You of course can use your eyes to see the general trend, but VWAP will help you see precisely how the trend changed between the days or even inside one day.
It’s very simple to use
Calculating an average number from several points in the day isn’t too time-consuming. Investors with mathematic proclivity deduce the numbers in their heads for fast trend checks. But if you want extensive logs stored in one document, use any spreadsheet software (like Excel).
If you want, you can even set up a more or less automated calculation algorithm in a spreadsheet, but it takes some research if you aren’t familiar if any adequate piece of software.
It works regardless of the asset type
The only two parameters required for calculations are volume and price. Therefore, you can use this formula for virtually any available type of asset (commodity, stock, currency, and so on). Granted, it works best with the shares and similar products, because average price means an average price as projected onto the individual asset, and the volume of share assets is usually fairly humble compared to other tradable resources.
Moreover, you don’t deduce the VWAP of the shares in general (though you may try if you want). In terms of shares, you generally deduce the index of one specific issuer. However, the process is far from share-oriented. Investors create extensive analysis sheets to see the trend of each piece from their portfolio, and the portfolio as a whole.
So, as you can see, it’s immensely practical and flexible.
Disadvantages of VWAP index
There are certain flaws, cons and shortcoming associated with VWAP. Don’t read too closely into them, however, VWAP is just a useful tool, it doesn’t offer enough features to be ‘flawed’ per se.
The purposes of VWAP are narrow This indicator won’t give you any solid results. It helps you understand if you did the right investment and where trend was heading past few days. It may seem that VWAP can be used to predict the movement of prices in the future, but it won’t. There’s no enough data to make such conclusions.
This task is the purpose of special algorithms. VWAP helps investors tinker these algorithms and make them work better. Furthermore, you get an inside into value movements, if you can read the results properly.
The results won’t give you much to work with Since VWAP processes historical information (the monumental data that won’t change anything), it can only give you insight into the respective time span. VWAP is perceived as a mandatory tool by many, but it’s just a helpful indicator. If you don’t work with the information, trading models, if you aren’t tasked with bringing market into balanced or keeping logs – chances are, VWAP won’t be of much use to you.
There are many more indicators that can help you with your particular situation and goals. Search and you’ll find the answer.


